These Data Analysis & Visualization courses cover a broad spectrum of topics, ensuring you stay current with industry standards and best practices.
 learnformulalearnformula
Transform raw data into clear, interactive dashboards that drive smart and informed business decisions.
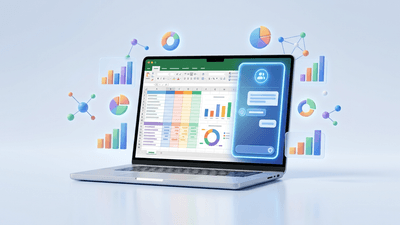
Stop struggling with complex formulas and start using AI to analyze, visualize, and manage your spreadsheets in seconds.

Stop wasting time on repetitive tasks by building your own Excel robots to automate your daily workflow.
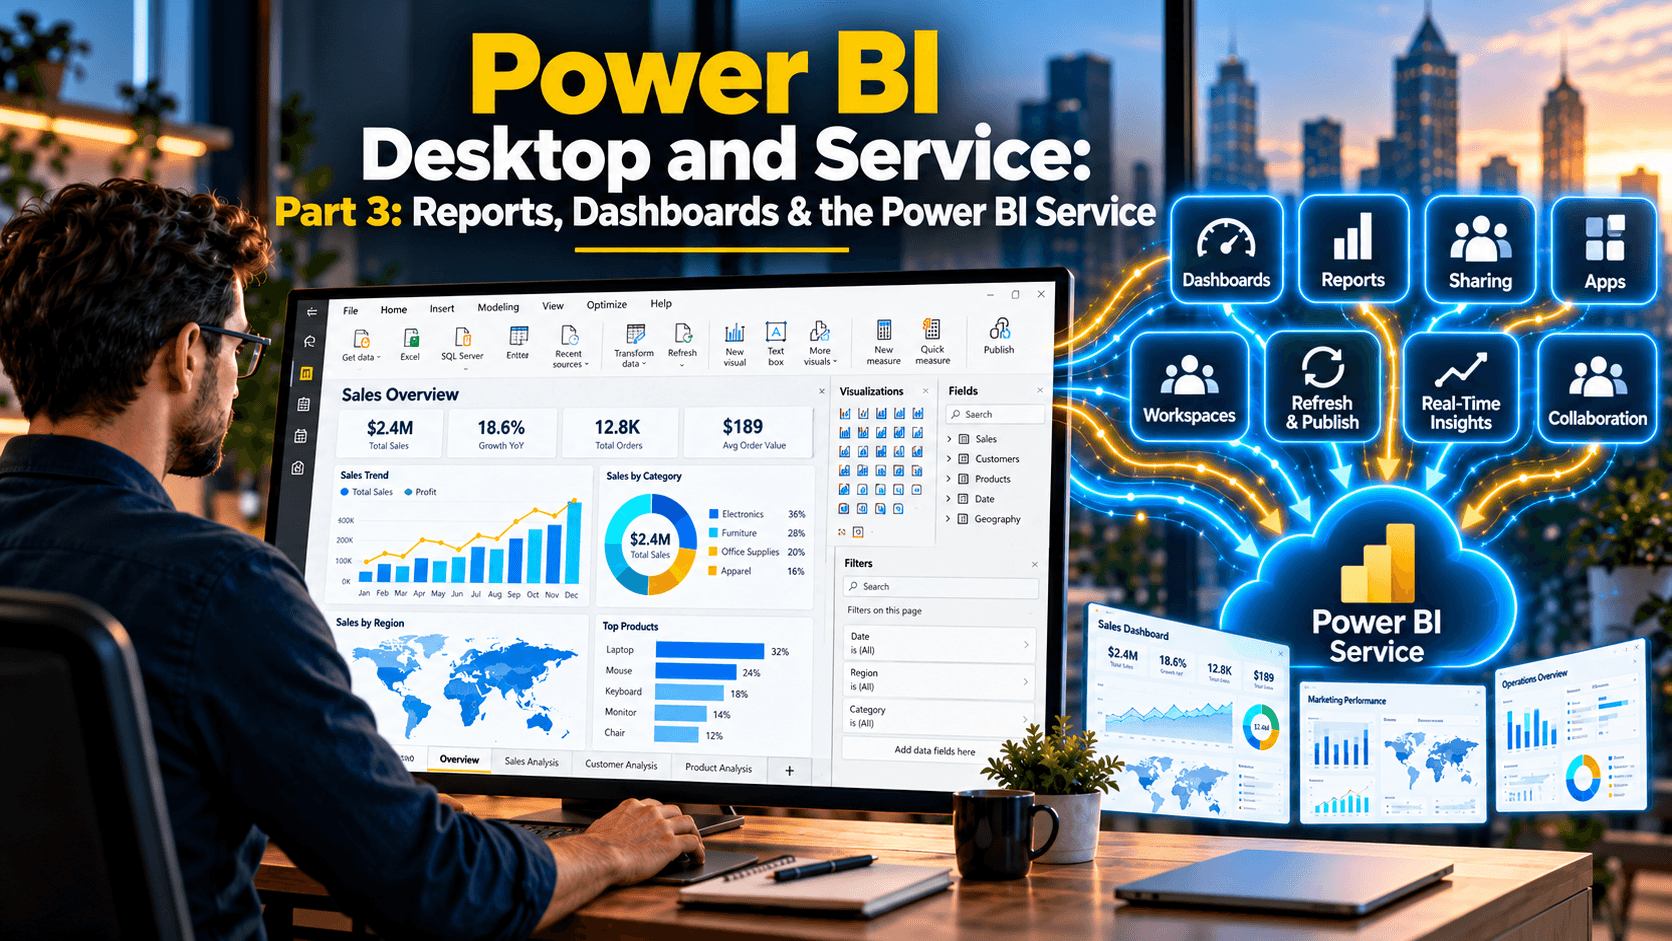
Design interactive Power BI reports, then publish, share and refresh them as dashboards and apps in the Power BI service
Try LearnFormula Business and buy packages or courses at a discounted group (multi-license) rate.

Learn many of Excel’s advanced tools for analyzing and communicating your data.

Master advanced automation and analysis tools to streamline financial reporting, minimize errors, and maximize efficiency in your accounting practice.

Stop struggling with complex data and let AI handle the heavy lifting, from automated mapping to advanced forecasting.
The course illustrates where does pivot table stand in the Excel Techniques, and brings up the topic of when to and when NOT to use a pivot table.

Get actionable insight from your data with Excel’s popular power tool.

Build on your foundational skills to transform raw data into dynamic insights through advanced cleanup, visualization, and automation techniques.